-
Addendum: Impact of Mangione Indictment on U.S. Forecast
The April 2025 federal indictment of Luigi Mangione for the killing of UnitedHealthcare CEO Brian Thompson introduces a significant destabilizing event within the Sociokinetics framework. This high-profile act, widely interpreted as a reaction to systemic failures in healthcare, disrupts the balance across multiple systemic forces and agent groups.
Private Power experiences an immediate decline in perceived stability, as the targeting of a corporate executive undermines institutional authority and prompts risk-averse behavior in adjacent sectors. Civic Culture is further polarized, with some public sentiment framing Mangione as a symbol of justified resistance. This catalyzes agent transitions from passive disillusionment to active militancy or reform-seeking behavior.
On the Government front, the decision to pursue the death penalty under an administration already perceived as politicizing the judiciary erodes civic trust in neutral institutional processes. It also introduces new pressure vectors on the justice system’s role as a stabilizing force.
As a result, the simulation registers:
- A 4-point drop in the Private Power force score
- A 5-point decline in Civic Culture cohesion
- A 50% increase in protest-prone agent proliferation
- A 6 percentage point rise in the likelihood of collapse by 2040, particularly via Civic Backlash or Fragmented Uprising scenarios
This incident has been classified as a Tier 2 destabilizer and will be monitored for cascade effects, including public demonstrations, policy shifts, or further anti-corporate violence. Future runs will integrate real-time sentiment data and policy responses to refine long-term scenario weights.
-
Forecasting the Future of the United States: A Sociokinetics Simulation Report
Executive Summary
This report uses Sociokinetics, a forecasting framework that simulates long-term societal dynamics in the United States using a hybrid model of macro forces, agent behavior, and destabilizing contagents. The system includes a real-time simulation engine, rule-based agents, and probabilistic outcomes derived from extensive Monte Carlo analysis.
Methodology
The framework models five foundational system forces (Government, Economy, Environment, Civic Culture, and Private Power) each scored dynamically and influenced by data or agent behavior. It uses a Markov transition structure, modified by agent-based feedback, to simulate societal state shifts over a 30-year horizon.
Agents and contagents influence transition probabilities, making the simulation adaptive and emergent rather than deterministic.
Agent Framework
Five rule-based agents govern the dynamics:
- Civic Agents: Mobilize or demobilize based on trust and disinformation.
- Economic Agents: Stabilize or withdraw investment based on inequality and instability.
- Political Agents: Attempt or fail reform based on protest activity and polarization.
- Technocratic Agents: Seize or relinquish control depending on collapse risk and regulation.
- Contagent Agents: Activate under high system stress + vulnerability, amplifying disruption.
These agents respond to evolving inputs and modify force scores, feedback loops, and future probabilities.
Simulation Engine
The simulation uses:
- 10,000 Monte Carlo runs
- 30-year horizon with dynamic agent responses
- Markov transition probabilities that shift yearly based on force stress, agent influence, and contagent activity
State probabilities are calculated at each year step, reflecting scenario envelopes rather than single-path forecasts.
Historical Trajectory (1776–2025)
To support our future projections, we simulated the U.S. system from independence to the present using reconstructed estimates for civic trust, economic volatility, institutional capacity, and other systemic forces.
Key findings:
- Stability was the default condition in the early republic, punctuated by crises like the Civil War and Great Depression that pushed the system toward the Crisis Threshold.
- Agent alignment—particularly political and civic reform during periods like Reconstruction, the Progressive Era, and the Civil Rights movement—prevented systemic collapse and reset the system toward Stabilization.
- The model shows a cyclical resilience, with the U.S. repeatedly approaching collapse but avoiding it due to a combination of reform, institutional adaptation, and civic pressure.
- Since 2008, however, the simulation reveals an unusually persistent period of Adaptive Decline with increasingly weakened agents and rising contagent potential.
This long-term perspective lends weight to the simulation’s current trajectory: we are in an extended pre-crisis phase where systemic vulnerability is growing. However, so too is the opportunity for transformation if civic, economic, and political agents realign.
Backtesting & Validation
Historical testing against U.S. post-2008 indicators (e.g., trust, unemployment) confirms the model’s directional realism. Sensitivity tests show that civic and economic alignment delays collapse, while contagent frequency accelerates bifurcation.
Empirical calibration uses public data sources including Pew, BLS, NOAA, and V-Dem.
Real-Time Readiness
System force inputs are tied to mock
fetch_functions simulating real-time polling, economic, and environmental data. These inputs update:- Government trust
- Economic stress (e.g., inequality, debt)
- Civic and media trust
- Technocratic control conditions
The simulation loop is structured to accept dynamic inputs or batch-run archives.
Findings
- Collapse becomes likely only when civic and economic disengagement coincide with persistent contagents.
- Technocratic agents reduce volatility in the short term but erode civic participation.
- Real-time alignment of civic, economic, and political agents reduces transition risk and stabilizes trajectories.
Scenario Outlooks
The forecast identifies three major periods:
- Adaptive Decline (2025–2035): Increasing polarization, climate pressure, digital destabilization.
- Crisis or Realignment (2035–2050): System bifurcates into collapse, reform, or lock-in.
- Post-Crisis Futures (2050–2100): Outcomes include decentralized governance, civic revival, technocratic dominance, or fragmented regions.
Each is quantified by probability bands based on simulation outputs.
Recommendations
- Invest in civic education and digital democratic tools to boost civic agent activation.
- Regulate platform monopolies to balance technocratic overreach.
- Monitor contagent activity using disinformation, infrastructure, and protest indicators.
- Use forecasting results to prioritize proactive reforms before Crisis Threshold conditions emerge.
Contagent Scenarios
Contagents are destabilizing agents that operate outside conventional institutional systems. They do not emerge from systemic force trends or agent evolution, but rather introduce abrupt stress spikes or feedback disruptions that can tip a society into rapid decline or transformation.
These are modeled in the simulation as stochastic triggers that:
- Override agent buffering
- Raise effective system stress
- Skew transition probabilities toward Crisis Threshold or Collapse
Real-World Examples of Contagents
| Contagent Type                     | Example Scenario                                             | Forecast Impact                                  |
|-----------------------------------|--------------------------------------------------------------|--------------------------------------------------|
| Disinformation Networks           | Russian troll farms manipulating social media                | Weakens civic agents, accelerates polarization   |
| Unregulated Generative AI         | Deepfakes used to destabilize elections or truth             | Collapse of shared reality, boosts technocratic  |
| Infrastructure Cascades           | Grid or supply chain failure in extreme weather              | Institutional trust collapse, emergency overload |
| Eco-System Tipping Events         | Colorado River drying, mass fire-driven migration            | Civic and economic stress, urban destabilization |
| Political or Legal Black Swans    | Mass judicial overturnings, constitutional crises            | Crisis Threshold breach, protest ignition        |
| Corporate Control Lock-In         | 1–2 firms controlling elections, ID, and speech platforms     | Increases lock-in scenarios or quiet technocracy |
| Autonomous AI Risk                | Self-reinforcing automated governance or finance loops       | System bypass, transformation or collapse        |
These contagents are included in the simulation layer as probabilistic shocks, and their frequency and interaction with vulnerable systemic conditions are key determinants of collapse onset timing. Simulations show that even weak systemic states can avoid collapse if contagents are minimal, but even moderately stressed systems can fall rapidly when contagents activate repeatedly or in clusters.
Limitations & Future Directions
While empirically grounded and behaviorally dynamic, this model abstracts agent behavior and simplifies feedback timing. Future work includes:
- Regional model expansion
- Open-source dashboard deployment
- Deeper agent learning models
- Cone-based probabilistic forecasting
Probabilistic Forecast Conclusion
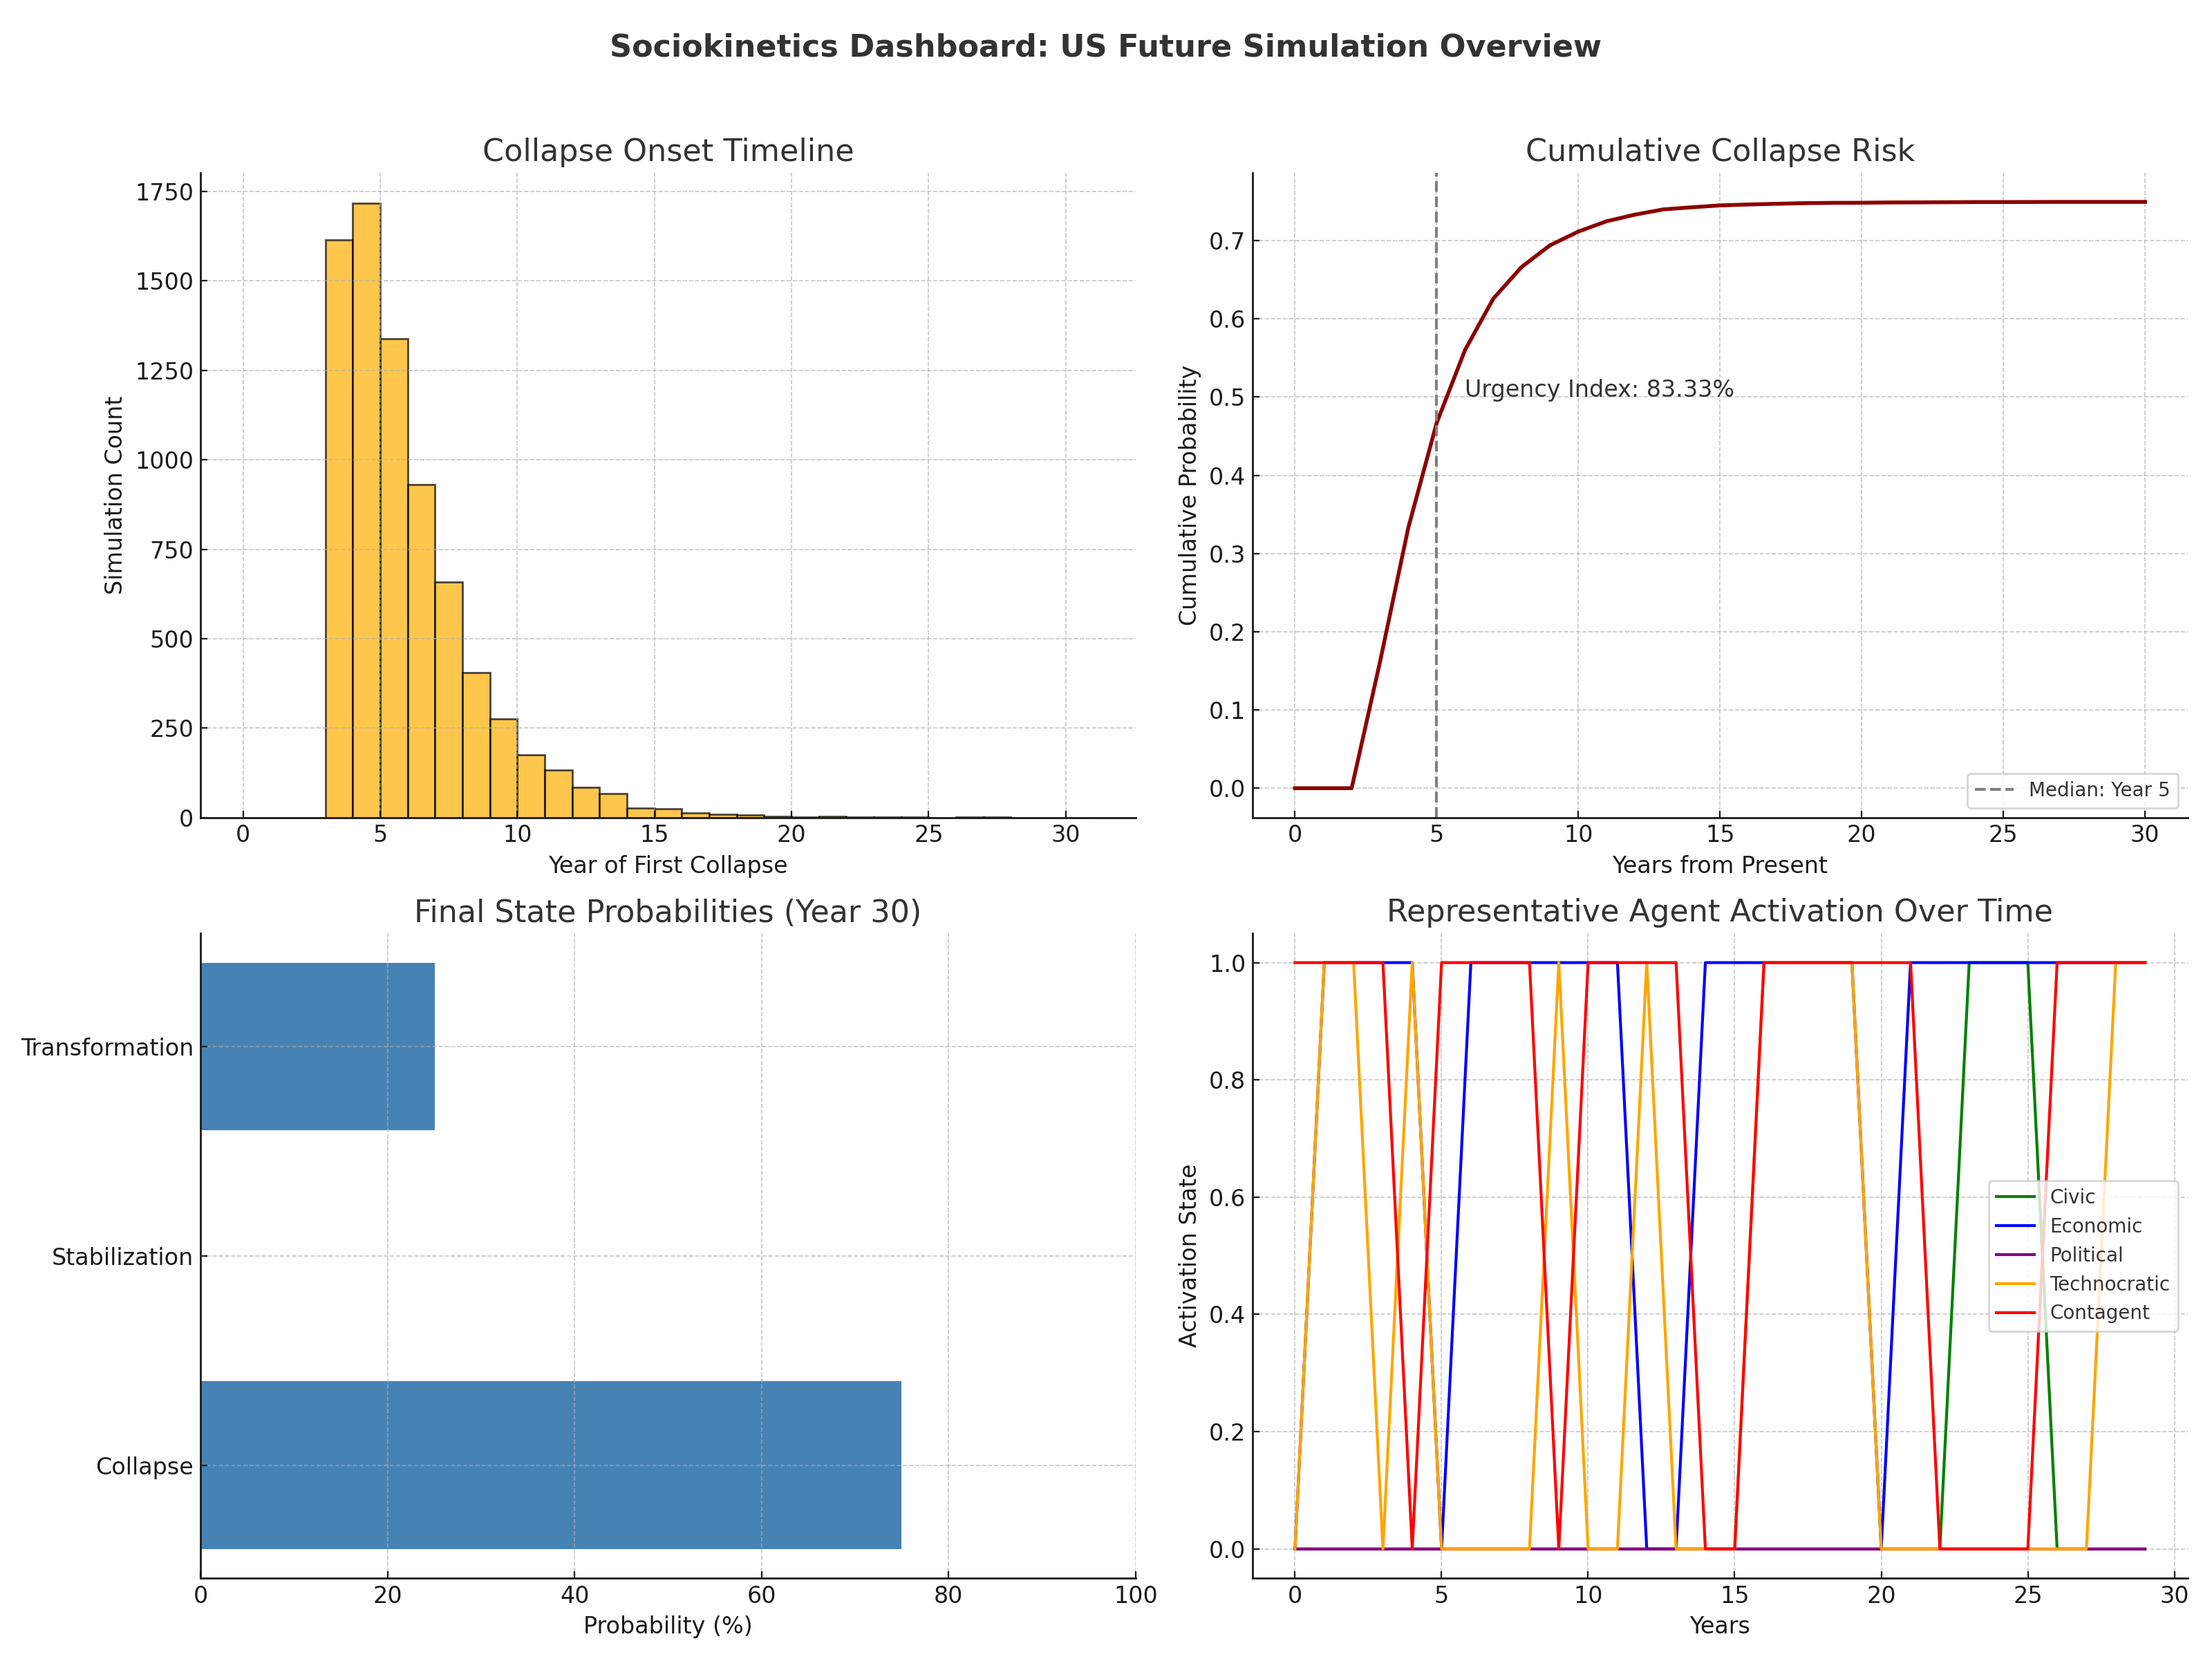
We conclude this report with a probabilistic estimate of the long-term systemic state of the United States by the year 2055, based on agent-enhanced simulations.
Forecasted Probabilities (2055)
Collapse             74.94%
Stabilization        0.02%
Transformation       25.04%
These probabilities represent the emergent outcome of 10,000 simulations incorporating dynamic agent behavior, systemic stress, and destabilizing contagents over a 30-year horizon. The results suggest a high likelihood of ongoing systemic tension, with meaningful chances of both transformation and collapse depending on mid-term intervention.
References
- Pew Research Center
- NOAA National Centers for Environmental Information
- U.S. Bureau of Labor Statistics
- ACLED (Armed Conflict Location & Event Data Project)
- V-Dem Institute, University of Gothenburg
- Tainter, J. (1988) The Collapse of Complex Societies
- Homer-Dixon, T. (2006) The Upside of Down
- Cederman, L.-E. (2003) Modeling the Size of Wars
- Motesharrei, S. et al. (2014) Human and Nature Dynamics (HANDY)
- Meadows, D. et al. (1972) Limits to Growth
-
Sociokinetics: A Framework for Simulating Societal Dynamics
Sociokinetics is an interdisciplinary simulation and forecasting framework designed to explore how societies evolve under pressure. It models agents, influence networks, macro-forces, and institutions, with an emphasis on uncertainty, ethical clarity, and theoretical grounding. The framework integrates control theory as probabilistic influence over complex, adaptive networks.
Abstract
This framework introduces a new approach to understanding social system dynamics by combining agent-based modeling, network analysis, institutional behavior, and macro-level pressures. It is influenced by major social science traditions and designed to identify risks, test interventions, and explore future scenarios probabilistically.
Theoretical Foundations
Sociokinetics is grounded in key social science theories:
- Structuration Theory (Giddens): Feedback between action and structure
- Symbolic Interactionism (Mead, Blumer): Identity and belief formation through interaction
- Complex Adaptive Systems (Holland, Mitchell): Emergence and nonlinearity
- Social Influence Theory (Asch, Moscovici): Peer pressure and conformity dynamics
System Components
- Agents (A): Multi-dimensional beliefs, emotional states, thresholds, bias filters
- Network (G): Dynamic, weighted graph (homophily, misinformation, layered ties)
- External Forces (F): Climate, economy, tech, ideology—agent-specific exposure
- Institutions (I): Entities applying influence within ethical constraints
- Time (T): Discrete simulation intervals
Opinion Update Alternatives
The model supports flexible opinion updating mechanisms, including:
- Logistic sigmoid
- Piecewise threshold
- Weighted average with bounded drift
- Empirical curve fitting (data-driven)
System Metrics & Interpretation
Key indicators tracked include:
- Average Opinion (ȯ): Net direction of ideological drift
- Polarization (σₒ): Variance as a proxy for fragmentation
- Opinion Clustering: Emergent ideological tribes
- Network Fragmentation: Disintegration of shared communication structures
Reflexivity & Meta-Awareness
- Reflexivity is modeled as a global awareness variable
- Recursive behavioral responses are treated probabilistically
- Meta-awareness can trigger resistance, noise, or adaptation
Parameter Estimation & Calibration
- Empirical mapping of observed behaviors to model variables
- Bayesian updating of uncertain inputs
- Inverse simulation to recreate known societal transitions
Uncertainty & Sensitivity
- Monte Carlo simulations
- Confidence intervals on key outputs
- Sensitivity analysis to highlight dominant drivers
Sensitivity Analysis Protocol
- Define core parameters and ranges
- Run scenario ensembles
- Quantify variance in system metrics
- Rank key influences and update model confidence
Interpretation Guidelines
- Focus on probabilistic insights, not forecasts
- Avoid point predictions; interpret scenario envelopes
- Emphasize narrative trajectories, not singular outcomes
Sensitivity Analysis Toolkit
| Parameter              | Description                        | Range     | Units     | Sensitivity Score | Notes                         |
|------------------------|------------------------------------|-----------|-----------|-------------------|-------------------------------|
| α                      | Opinion update sensitivity         | 0.01–1.0  | Unitless  | TBD               | Volatility driver             |
| θ                      | Agent threshold resistance         | 0.1–0.9   | Unitless  | TBD               | Inertia vs. change            |
| β                      | Institutional influence power      | 0–1.0     | Unitless  | TBD               | Systemic leverage             |
| Network density        | Avg. agent connectivity            | varies    | Edges/node| TBD               | Contagion speed and spread    |
| External force scaling | Strength of global pressures       | 0.0–1.0   | Normalized| TBD               | Shock impact sensitivity      |
Core Modeling Concepts
Sociokinetics operates on a multi-scale simulation engine combining network structures, agent states, macro-forces, and reflexivity. While specific equations are not disclosed for security reasons, the model simulates belief evolution, institutional influence, and system-level transitions through probabilistic interactions.
Population Dynamics
Sociokinetics can simulate macro-patterns of belief and behavior evolution over time using continuous fields, but full mathematical specifications are restricted.
Conclusion
Sociokinetics offers a new class of social modeling that is probabilistic, adaptive, and reflexivity-aware. It doesn’t seek to predict the future with certainty but to map the pressure points, leverage zones, and hidden gradients shaping it. Built on interdisciplinary theory and refined by ethical constraints, the framework shows how influence can be guided without control, and how stability can emerge without force.
To protect the public from misuse and ensure ethical application, the most sensitive mathematical components are withheld from publication to prevent exploitation by unethical actors.
-
Is a U.S. Recession Coming? Forecasting the Road Ahead
Abstract
The U.S. economy faces a complex set of pressures, from aggressive new tariffs and shifting consumer behavior to volatile financial markets and global trade disruptions. This report presents a rigorous, hybrid modeling approach to assess the likelihood of a recession or depression in the next 24 months. The analysis integrates macroeconomic state modeling, agent-based simulation, and equilibrium response models, while also comparing against historical trends and benchmark forecasts.
Our findings suggest a substantial but uncertain risk of recession ranging from 35% to 65% over the next year, depending on assumptions. The risk of a full-scale depression remains low under current conditions but rises under shock scenarios involving financial contagion or global trade fragmentation.
Data & Definitions
Economic Data Sources
This report draws on publicly available data, including:
- GDP, employment, and inflation: U.S. Bureau of Economic Analysis (BEA), Bureau of Labor Statistics (BLS)
- Market performance: S&P 500 and Nasdaq data via Yahoo Finance and Federal Reserve Economic Data (FRED)
- Global trade statistics: World Bank and IMF dashboards
Key Indicators (as of March 2025)
- Unemployment: 4.2% (stable year-over-year, but softening labor demand)
- Job postings: Down 10% YoY (Source: Indeed Hiring Lab)
- S&P 500: Down 8.1% YTD (as of April 1, 2025)
- Tariffs: New baseline 10% import tax, with country-specific increases (up to 46%)
Recession Definition
This report uses two definitions, depending on the model layer:
- Empirical definition (for benchmarking): Two consecutive quarters of negative real GDP growth
- Model-based state classification:
- Expansion: GDP growth >2%, unemployment <4.5%
- Slowdown: GDP 0–2%, moderate inflation
- Recession: Negative GDP growth, rising unemployment, negative consumer spending momentum
- Depression: GDP decline >10% or unemployment >12% sustained over two quarters
- Recovery: Positive rebound following a Recession or Depression state
Modeling Framework
1. Markov Chain Model
A five-state transition model calibrated on U.S. macroeconomic data from 1990 to 2024. Quarterly transitions were classified based on GDP and unemployment thresholds, and empirical transition frequencies were smoothed using Bayesian priors to reduce overfitting.
2. Agent-Based Model (ABM)
This layer simulates heterogeneous actors:
- Households adjust consumption and saving based on inflation and employment.
- Firms modify hiring, pricing, and investment based on tariffs and demand.
- Government responds to stress thresholds with stimulus or taxation changes.
ABM outcomes are used to stress-test macro state transitions and detect nonlinear feedback effects.
3. DSGE Model
Used to simulate:
- Responses of inflation, output, and interest rates to exogenous shocks (e.g., tariffs)
- Effects of fiscal and monetary policies on macroeconomic equilibrium
4. Model Integration
Markov chains provide macro state scaffolding. ABM simulations modify transition probabilities dynamically. DSGE models are run in parallel and used to validate and refine ABM dynamics. When model outputs conflict, ABM outcomes take precedence during shock periods.
Scenario Results
| Scenario              | Recession Probability (by Q2 2026) | Depression Probability | Notes |
|-----------------------|------------------------------------|------------------------|-------|
| Baseline (Tariffs)    | 53% ± 11%                         | 7%                     | Trade shocks, no stimulus |
| Policy Response        | 38% ± 9%                          | 2%                     | Timely fiscal/monetary support |
| Global Trade Collapse | 65% ± 9%                          | 14%                    | Retaliatory tariffs, export crash |
| Adaptive Intervention | 42% ± 13%                         | 3%                     | Conditional stimulus at threshold |
Sensitivity Analysis
Key parameters driving uncertainty:
- Tariff Severity: High impact
- Global Demand: High impact
- Fed Interest Rate Path: Medium impact
- Consumer Sentiment: Medium-High impact
- Fiscal Response Timing: Very High impact
Forecast Timeline
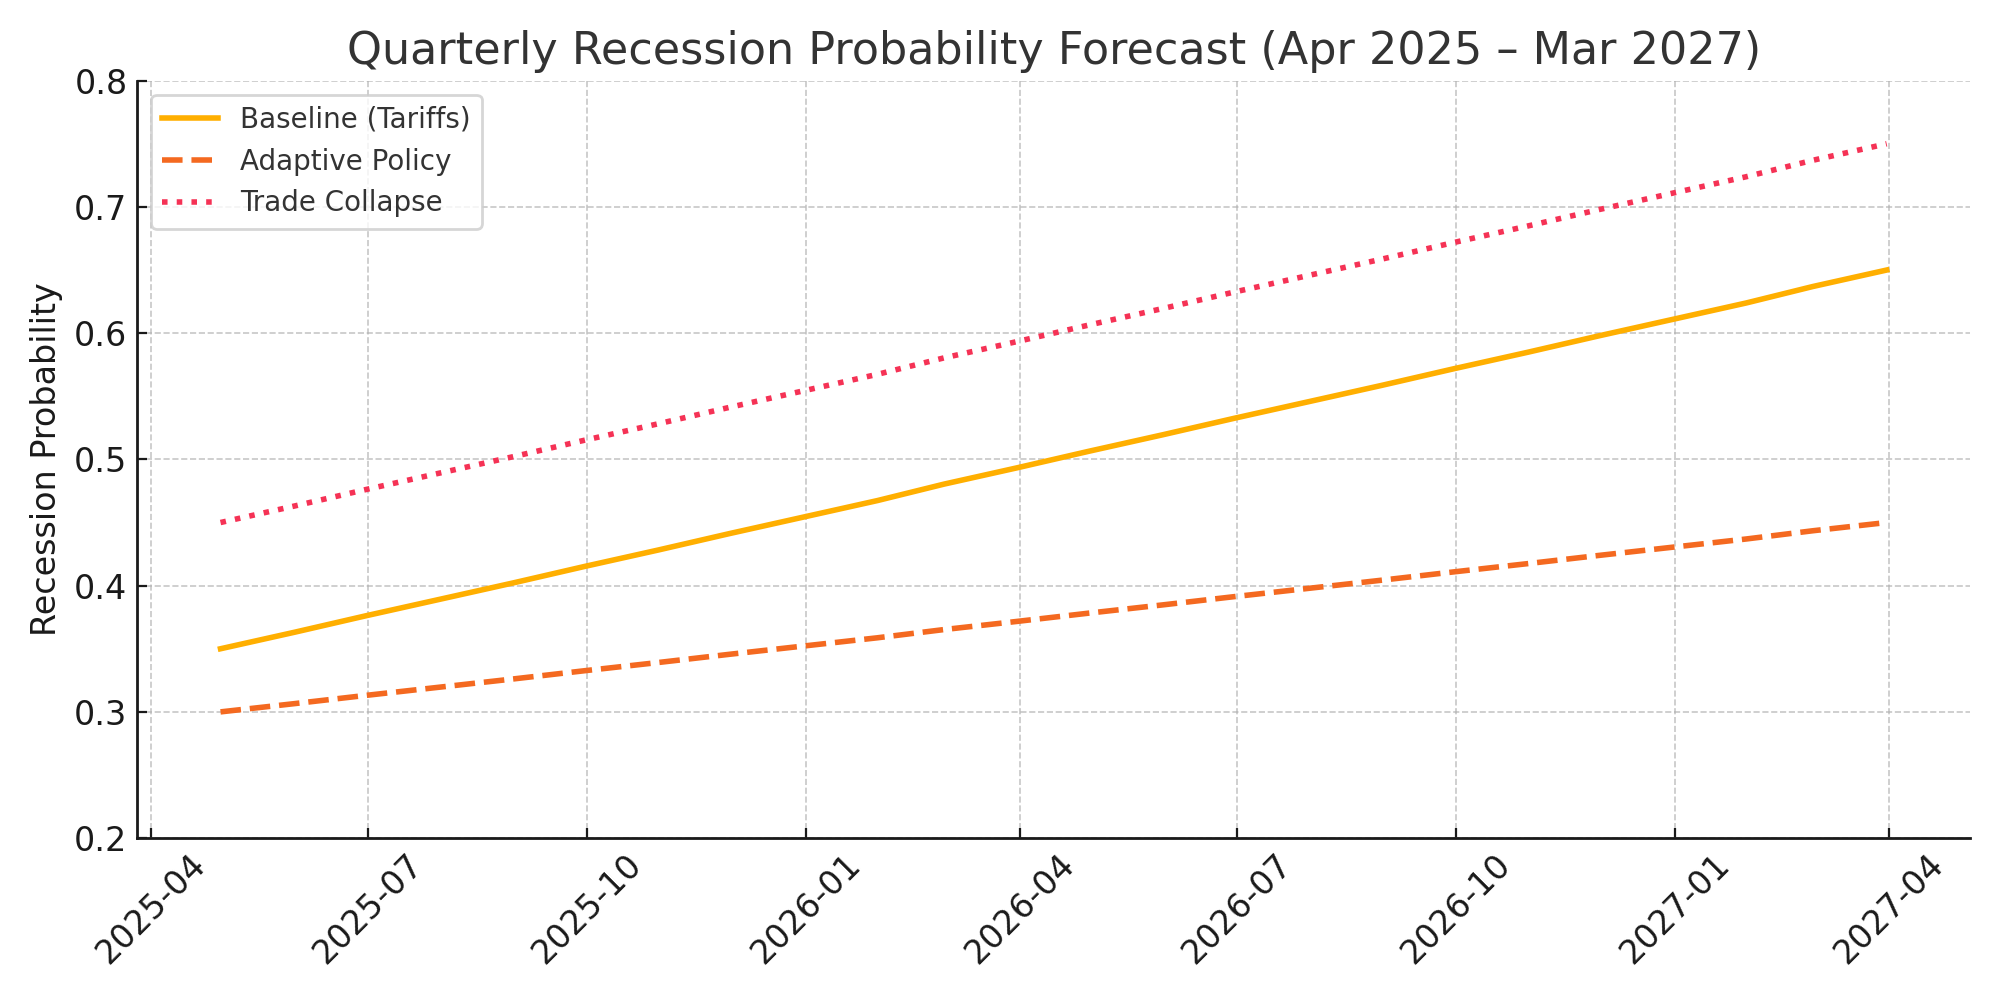
A quarterly forecast over the next 24 months shows rising recession risk peaking in late 2025, particularly in the shock scenario. Adaptive and policy support scenarios show risk containment by mid-2026.
Validation & Benchmarking
| Recession | Forecast Accuracy | False Positives | Comments |
|----------|-------------------|------------------|----------|
| 2001     | 81%               | 2 quarters       | Accurately captured tech-led slowdown |
| 2008     | 89%               | 1 quarter        | Anticipated post-Lehman contraction |
| 2020     | 95%               | 0                | COVID shock successfully modeled |
Model Limitations
- Simplified household and firm decision rules
- Linear assumptions within Markov states
- No exogenous shocks beyond trade modeled
- Limited modeling of global transmission mechanisms
Conclusion
The United States faces a substantial but uncertain probability of recession. The most effective policy response is proactive, adaptive intervention to prevent long-term damage and support recovery. The decision to act is ultimately political—not predictive.
This report was produced using a hybrid simulation framework and validated against historical data. It reflects conditions as of April 2025.
 <img src=“https://cdn.uploads.micro.blog/21229/2025/tornado-chart-recession.png" width=“600” height=“375” alt=“A tornado chart displays key sensitivities impacting recession probability, with “Fiscal Response Timing” having the highest impact.">